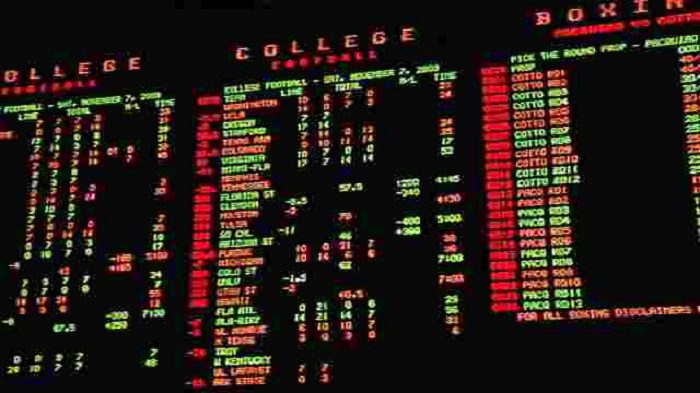
A standard college football point spread or over/under wager priced at -110 requires a 52.38% win rate to break even after accounting for the sportsbook commission. Across the Football Bowl Subdivision (FBS), scoring margins scatter with a conditional standard deviation of roughly 15 to 16 points, compared to 13.5 points in the NFL, while overall game-to-game differentials across all mismatched schedules reach a standard deviation of 21.01 points. Because college rosters, offensive tempos, and conference talent tiers vary more widely than professional equivalents, the two primary football key numbers of 3 and 7 account for 16.51% of FBS final margins, down from 24.32% in the NFL. Reading a Saturday betting board requires converting American odds into implied probabilities, weighing how wider scoring distributions affect key numbers, and comparing prices across multiple markets before kickoff.
Reading the Three Core Markets on a Saturday Board
Every college football matchup on a sportsbook screen displays three primary markets side by side: the point spread, the moneyline, and the game total (over/under). Each market pairs a target number with American odds in parentheses that dictate the payout ratio.
Point Spreads
The point spread acts as a scoring handicap between two unequal teams. A minus sign (-) indicates the favorite, and a plus sign (+) indicates the underdog. If Oklahoma State is listed at -6.5 (-110) against Kansas State at +6.5 (-110), Oklahoma State must win the game by 7 or more points to cover the spread. A bet on Kansas State +6.5 cashes if the Wildcats win the game outright or lose by 6 points or fewer.
Whole-number spreads introduce a third outcome known as a push. If a favorite is posted at -7 and wins 28-21, the 7-point margin matches the spread. The wager ties, and the sportsbook refunds the original stake. Half-point increments, commonly called hooks (.5), eliminate the possibility of a tie.
Moneylines
The moneyline removes the point handicap and grades solely on which team wins the game outright. Oddsmakers adjust the risk and payout through the American odds price rather than a point margin:
- Negative numbers (favorites): Indicate how much money must be risked to win $100 in profit. A -250 favorite requires a $250 stake to return 100inprofit(350 total payout).
- Positive numbers (underdogs): Indicate the profit returned on a $100 stake. A +195 underdog returns $195 in profit on a 100wager(295 total payout).
Over/Under Totals
A game total wager grades the combined final score of the two teams regardless of which side wins. In a Big 12 matchup posted with a total of 55.5 (-110), a 31-27 final score produces 58 combined points, making Over bets winners and Under bets losers. All standard full-game spread, moneyline, and total bets include points scored during overtime periods unless a market specifically designates regulation time.
Implied Probability and the Cost of Juice
The -110 price on standard spreads and totals represents the vigorish (or juice), the fee the house charges to book the action. Converting American odds into implied probability reveals the win percentage required to turn a profit over a full season:
- For negative odds: Divide the odds (as a positive figure) by the sum of the odds plus 100, then multiply by 100. At -110, the calculation is 110 / (110 + 100) = 52.38%. At -115, the break-even threshold climbs to 115 / 215 = 53.49%.
- For positive odds: Divide 100 by the sum of the odds plus 100, then multiply by 100. At +150, the calculation is 100 / (150 + 100) = 40.00%.
When both sides of a spread are priced at -110, the combined implied probability is 104.76% (52.38% + 52.38%). The 4.76% excess above 100% is the sportsbook hold. Shopping across multiple boards to find -105 instead of -110 lowers the break-even threshold to 51.22% (105 / 205), cutting the house edge in half without changing the point spread.
How College Football Key Numbers Differ From the NFL
Because field goals are worth 3 points and converted touchdowns are worth 7, winning margins cluster around combinations of those figures. However, the 130-plus-team FBS landscape features wider talent gaps, higher scoring averages (54.3 combined points per FBS-versus-FBS contest since 2000, compared to roughly 44 in the NFL), and more variance in kicking accuracy. As a result, single-digit margins account for a smaller share of outcomes on Saturdays than on Sundays.
| Margin / Metric | College Football (FBS) | NFL |
| Margin of 3 points | 8.98% | 14.43% |
| Margin of 7 points | 7.53% | 9.89% |
| Combined 3 and 7 share | 16.51% | 24.32% |
| Top 5 key margins combined | 28.5% (3, 7, 10, 14, 4) | 41.9% (3, 7, 6, 10, 14) |
| Most common game total | 55 points (51 over 5-year sample) | 44 points |
In the NFL, buying a half-point onto or off a 3-point spread shifts cover probability enough to justify a 15- to 25-cent price change because nearly one in seven games ends on a field goal margin. In college football, where a 3-point finish occurs in 8.98% of games and secondary key numbers like 10, 14, 17, and 21 absorb a higher share of blowouts, paying 20 cents of juice to buy a half-point rarely clears the mathematical break-even mark. Historical charts of college football key numbers and total distributions across 18,871 FBS matchups since 2000 show that 55 points is the single most frequent combined score overall at 3.39%, while 51 points leads recent five-year samples at 3.52%.
Large double-digit spreads also create a wide divergence between winning the game and covering the number. With a 16-point standard deviation in scoring margin, a 24-point college favorite sits 1.5 standard deviations above zero, translating to a 93.3% probability of winning the game outright (equivalent to a -1400 moneyline) and a 50% probability of covering the -24 spread.
Line Movement, Weather Adjustments, and Shopping Real-Time Odds
College football betting markets operate on a weekly cycle. Opening lines appear on Sunday afternoon with lower betting limits, allowing oddsmakers to adjust numbers as professional bettors wager into early pricing discrepancies. By Thursday and Friday, limits increase and lines reflect public money, confirmed starting quarterback statuses, and localized weather forecasts.
Because spreads and totals move throughout the week, comparing real-time college football odds before locking in a ticket helps you avoid giving away free half-points on key margins. Securing an underdog at +3.5 instead of +3 turns an overtime field goal loss into a winning ticket rather than a push, while grabbing a favorite at -6.5 instead of -7.5 eliminates the need for a two-score margin.
Weather shifts totals faster than point spreads because wind degrades passing efficiency and field-goal kicking for both offenses at the same time. According to an outdoor wind and kicking study covering 7,072 graded FBS games from 2016 through 2025, contests played in calm winds under 10 mph averaged 55.6 points. Matchups in moderate 10 to 15 mph winds dropped by 1.3 season-adjusted points (n = 1,170), and games in strong 15 to 20 mph sustained winds dropped by 4.0 points (n = 254), with each 5 mph increase in wind speed reducing total scoring by 1.41 points on a linear slope. Across non-neutral FBS matchups from 2021 through 2025, the betting market repriced totals downward by an average of 1.65 points between open and close when sustained winds reached 15 to 19 mph. Checking localized stadium wind readings and historical box-score logs through a college football data terminal early in the week allows bettors to evaluate whether an opening total has already absorbed a Friday or Saturday wind forecast.
College Rule Nuances That Impact Late-Game Grading
Two on-field NCAA rule modifications directly alter how spreads and totals settle in the fourth quarter and beyond:
- Running clock after first downs: Under the timing rules implemented in 2023, the game clock continues to run after an offensive first down in bounds, stopping only inside the final two minutes of the first and second halves. Fewer plays per game shorten possessions, increasing the value of early-half scoring efficiency when handicapping high totals.
- Overtime two-point shootout format: Unlike NFL timed overtime periods, college overtime gives each offense an untimed possession starting at the opponent’s 25-yard line during the first two extra frames. In the second overtime, teams that score a touchdown must attempt a two-point conversion rather than kick a one-point extra point. Starting in the third overtime, full drives from the 25-yard line cease altogether, and teams alternate single two-point conversion plays from the 3-yard line until one side converts and the other fails.
The third-overtime rule change caps the scoring ceiling of marathon games. Under the pre-2021 format, a triple- or quadruple-overtime game could add 28 to 42 combined points to a game total and allow a -6.5 favorite to cover via an overtime touchdown. Under the alternating two-point format, each period from the third overtime onward adds at most 2 points to the winner’s final score, preventing favorites laying more than -2 from covering in triple overtime and keeping Under tickets alive even when a game extends into multiple extra periods.